Digital Maturity Levels (1-5): Scorecard Interpretation
Digital maturity isn’t a buzzword. It’s a decision framework: assess capability, compare to peers, and prioritize investments. This guide explains the 5-level model and how to read scorecards and benchmarks so you can act with confidence.
Digital maturity levels classify an organization’s capabilities across defined dimensions, typically from Level 1 (ad hoc) to Level 5 (optimized). Scorecards translate survey responses and evidence into weighted ratings that reveal gaps, dependencies, and execution priorities.
Looking for framework selection first? Start with analyst model comparison. For converting scores into delivery, see the strategy-to-execution gap guide.
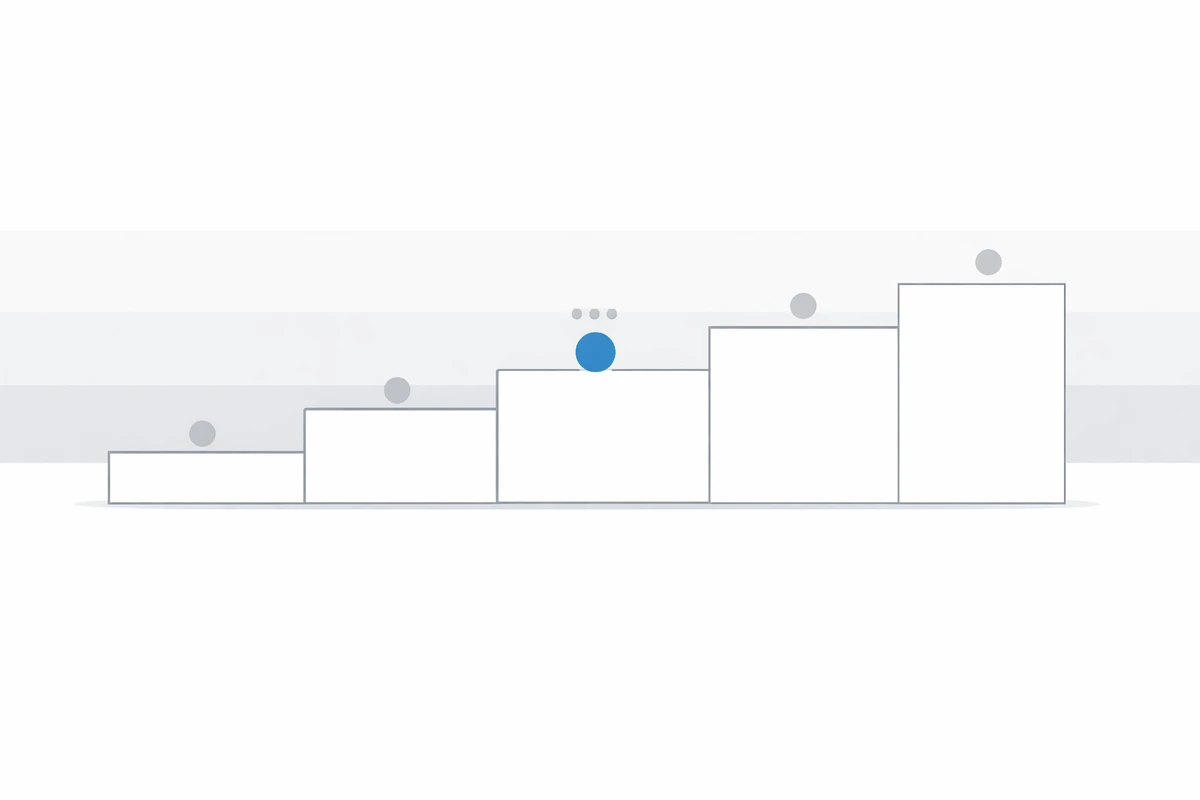
The 5-level digital maturity framework
Many models use different labels, but they converge on a similar maturity ladder. This version is inspired by common analyst patterns (McKinsey / Gartner / BCG) and is designed to be scorecard-ready.
Capability maturity levels explained: Level 1-5 summary
| Level | Description | Risk Profile | Typical Symptoms | Next Priority |
|---|---|---|---|---|
| 1 | Ad hoc and reactive execution | High | Fragmented ownership, low repeatability | Establish baseline governance and standards |
| 2 | Emerging capabilities and local pilots | Medium-high | Inconsistent outcomes across teams | Standardize processes and evidence collection |
| 3 | Established and repeatable practices | Medium | Partial scaling, uneven cross-functional delivery | Tighten dependency sequencing and value tracking |
| 4 | Advanced and optimized capabilities | Medium-low | Performance strong, but bottlenecks remain | Industrialize operating model and portfolio controls |
| 5 | Leading, adaptive, innovation-embedded | Low | Continuous improvement with guardrails | Sustain advantage and targeted frontier bets |
- Level 1: Ad Hoc (reactive) — fragmented initiatives, no formal strategy or governance.
- Level 2: Emerging (basic capabilities) — early tools and pilots, inconsistent execution.
- Level 3: Established (standardized) — repeatable processes and governance, moderate ROI.
- Level 4: Advanced (optimized) — scalable platforms, strong measurement, competitive advantage.
- Level 5: Leading (transformative) — best-in-class practices, continuous innovation embedded in culture.
If you’re looking for the artifacts behind the rating (survey → scoring → benchmarks → scorecards), see Digital Maturity Benchmarks, Surveys & Scorecards.
See how your organization scores across 8–12 dimensions using a structured digital maturity scorecard via our self-serve tool or consulting-led assessment.
How to interpret a maturity scorecard
A scorecard is useful when it helps leadership make decisions: what to prioritize, what to sequence, and where progress should be measured. Use these lenses to avoid “pretty charts” that don’t change what happens next.
- Distribution beats average. An “overall 3.1” can hide a constraint: one or two low dimensions (often data/AI enablement or governance) can cap outcomes everywhere else.
- Variance signals misalignment. If leaders rate maturity high but practitioners rate it low (or vice versa), the gap is usually governance, measurement, or execution reality—not “tools”.
- Look for dependencies. Modernization without operating model change, or AI pilots without data quality and risk controls, usually yields volatility rather than repeatable value.
- Translate to decisions. A scorecard should drive 3–5 commitments: what to fund, what to stop, and what to sequence.
How maturity levels are calculated
- Dimension scoring: Each question maps to one or more capability dimensions.
- Weighting logic: Dimensions are weighted based on strategic and risk relevance.
- Evidence validation: Survey results are cross-checked with interviews or artifacts where needed.
- Aggregation method: Dimension scores roll up into segment and enterprise-level maturity profiles.
What changes by level (practical signals)
| Level | Evidence you can point to | What leaders typically prioritize next |
|---|---|---|
| 1–2 | Local initiatives; unclear ownership; weak measurement | Define governance, standards, and a focused baseline program |
| 3 | Repeatable processes; partial standardization; uneven execution | Scale 2–3 core capabilities and tighten value tracking |
| 4 | Shared platforms; consistent delivery; clear KPIs | Optimize portfolios, remove bottlenecks, and industrialize change |
| 5 | Continuous improvement embedded; experimentation with guardrails | Stay ahead through talent, ecosystem, and frontier bets |
Example interpretation patterns (sanitized)
Want to see what the underlying artifacts look like (survey, benchmark, sample scorecards and radar charts)? Jump to sample outputs.
Common mistakes in interpreting maturity levels
- Treating levels as linear progression: Different capabilities mature at different rates and priorities.
- Ignoring dimension weighting: Unweighted averages can hide strategic constraints.
- Confusing perception with evidence: Self-ratings without validation distort reality.
- Over-indexing on tools: Platform upgrades alone do not create operating capability.
For teams asking what Level 3 digital maturity means or which digital maturity level 4 characteristics matter most, the answer should always connect back to your enterprise digital maturity rating scale and execution constraints.
How benchmarks add context
A level only becomes actionable when you compare it to peers and clarify what “good” looks like for your sector and size band.
- Peer benchmarks: similar-sized organizations in your sector.
- Industry benchmarks: directional baseline across a broader sample.
- Best-in-class: top-quartile profiles to highlight the practical gap.
2026 update: AI's impact on digital maturity levels
AI capability expectations are raising the threshold for Level 3+ in many organizations. Data quality, governance automation, and model risk controls now materially affect how maturity is interpreted and prioritized.
- Level 3 now often requires repeatable AI use-case governance, not just experimentation.
- Automation can improve scoring speed, but evidence validation remains mandatory.
- Data maturity increasingly determines AI readiness and achievable maturity progression.
Turning scorecards into action
A scorecard alone isn’t a plan. The most useful outputs pair quantified gaps with a short list of initiatives that have owners, sequencing, and success metrics.
- Radar charts to show strengths/weaknesses at a glance.
- Prioritized roadmaps (6–12 months) with workstreams and milestones.
- Vendor scorecards when AI / platform decisions are a constraint.
Want a benchmarked baseline and an executive-ready roadmap?
Prefer to browse examples first? See sample outputs.
Author
Ahmed Abbas - Founder & CEO, DUNNIXER
Former IBM Executive Architect with 26+ years in IT strategy and enterprise architecture.
Advises CIO and CDO teams on digital maturity, portfolio governance, and decision-grade modernization planning. View author profile on LinkedIn.
Frequently asked questions
Quick answers on how to interpret maturity levels and turn scorecards into practical priorities.